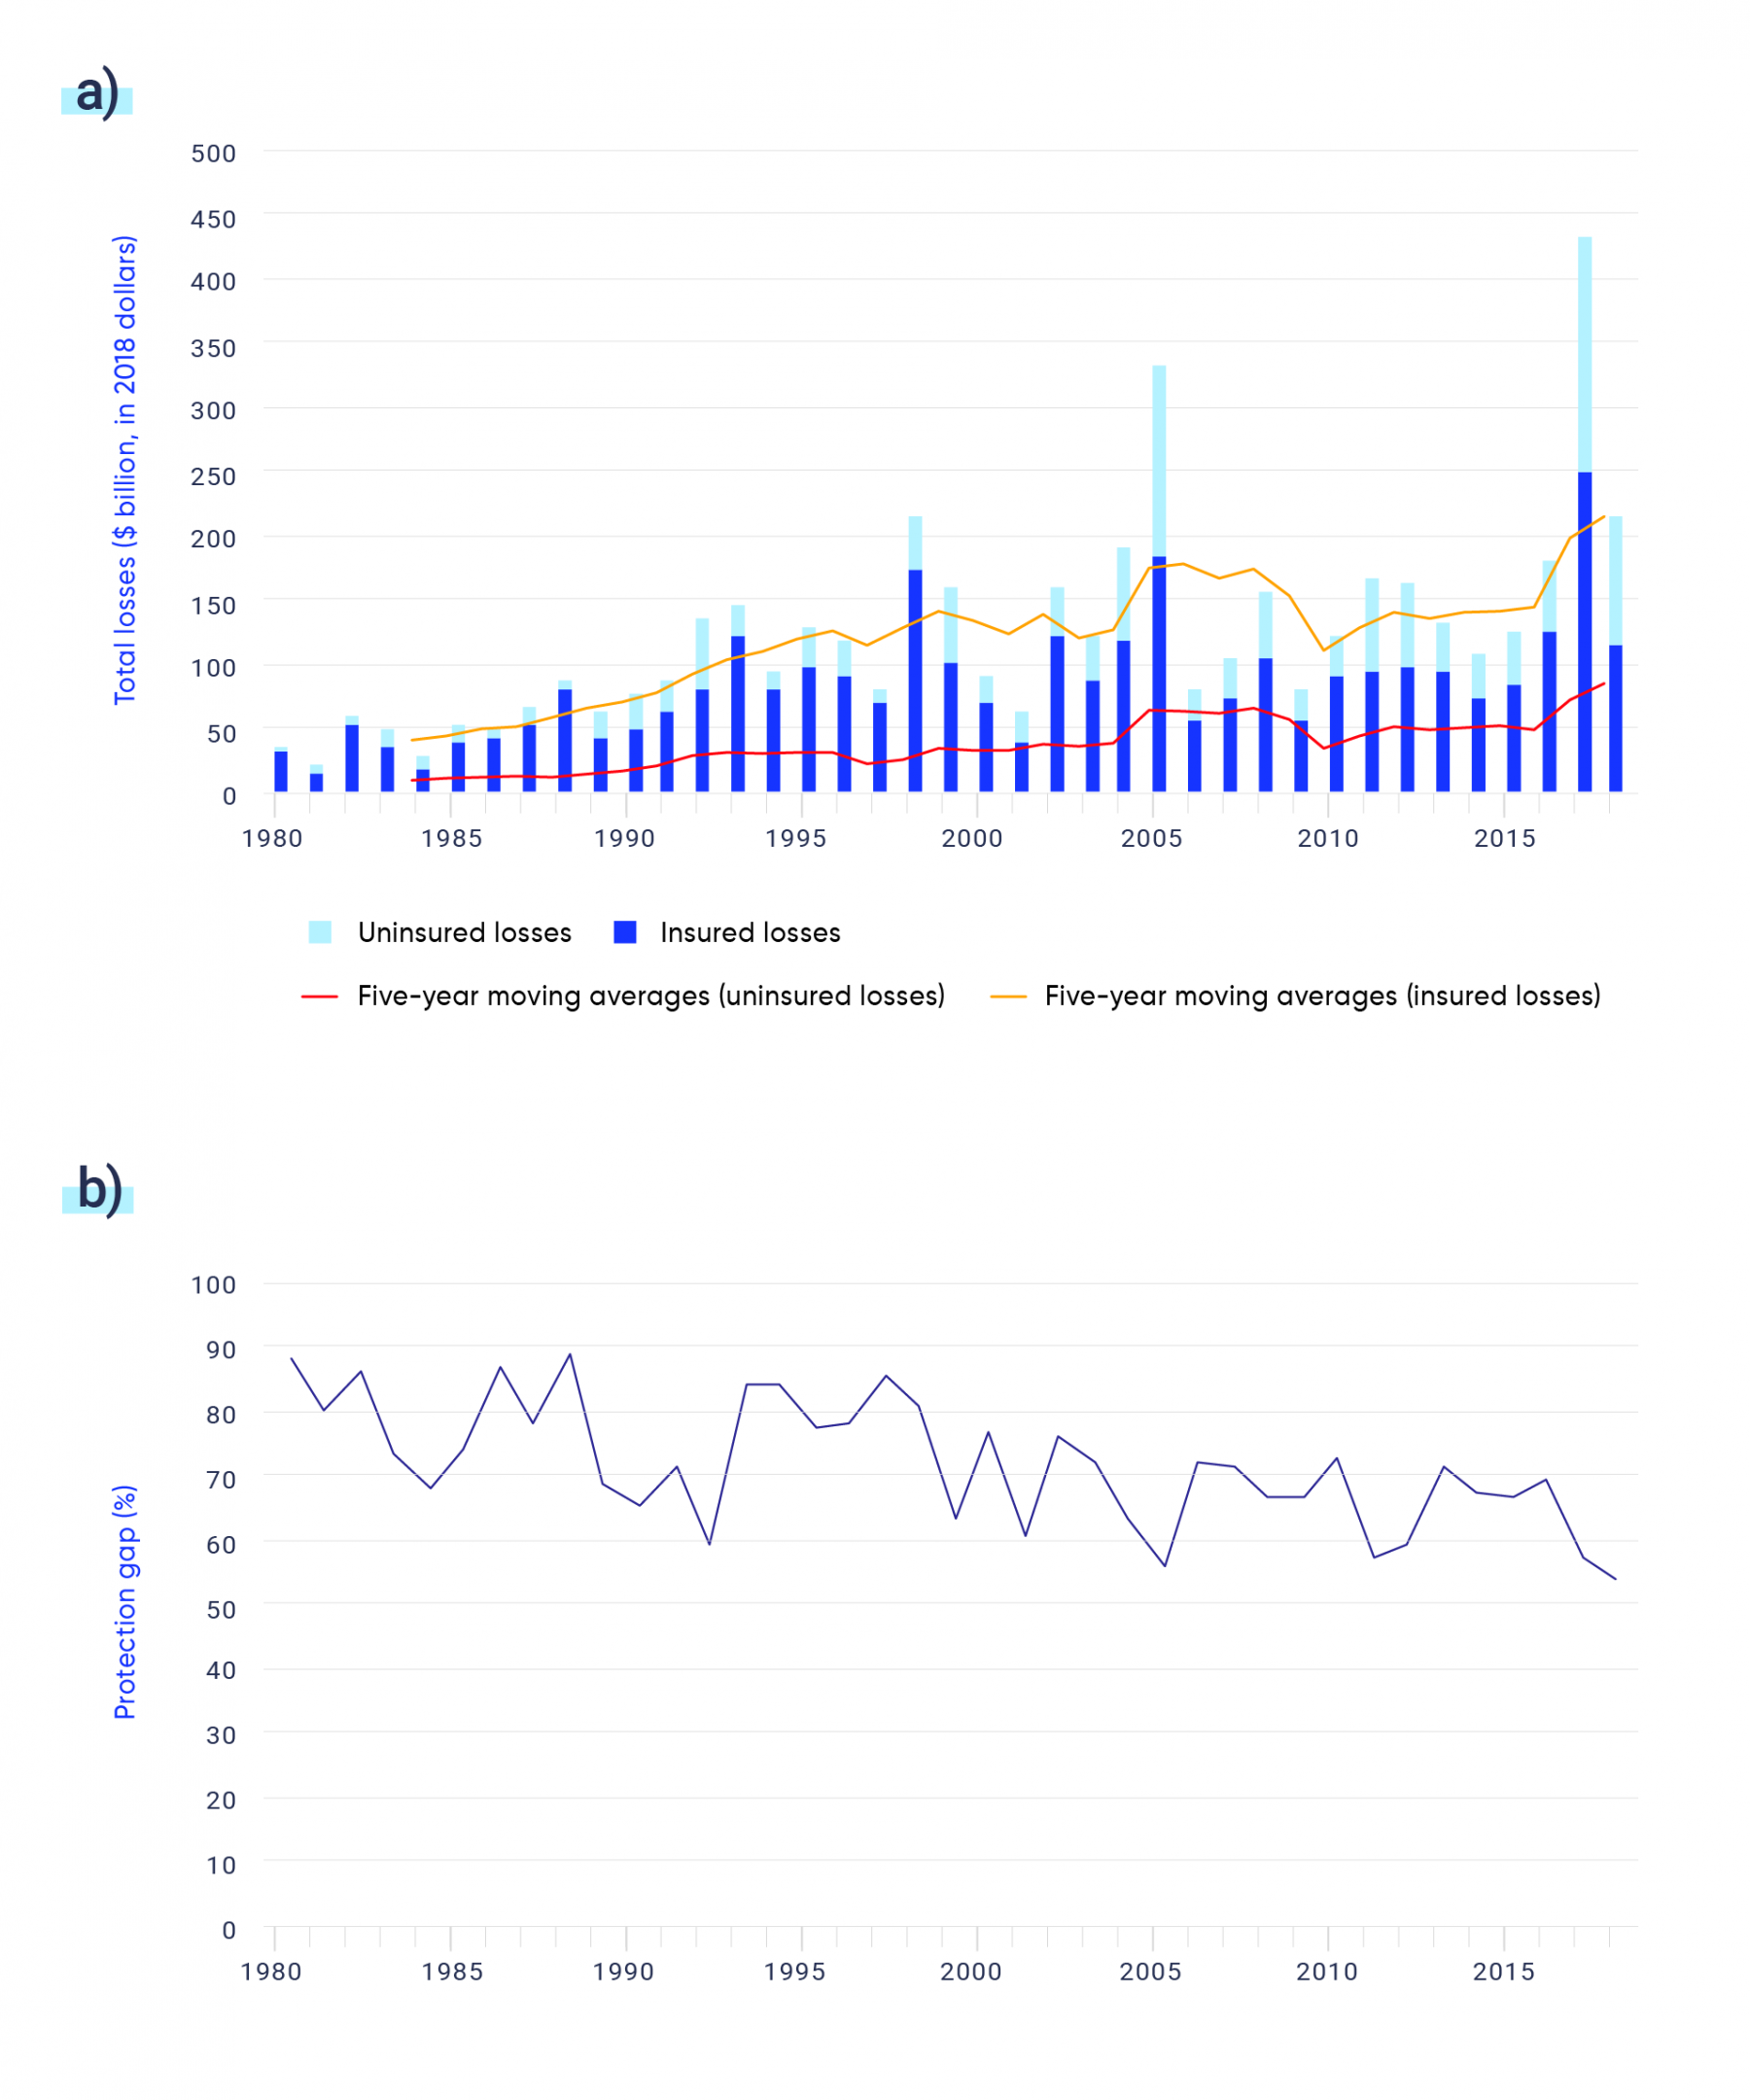
The figure shows annual insured and uninsured losses (in 2018 Canadian dollars) from 15,788 weather-related events (e.g., flooding, storms, wildfires, extreme heat, etc.) worldwide that meet Munich RE’s NatCatSERVICE inclusion thresholds for dollar losses and fatalities over the period 1980‒2017. a) The dark blue bars indicate the total insured losses and the light blue bars indicate the total uninsured losses from all weather-related loss events globally in each year. The combined light blue and dark blue bars indicate the total economic losses from all weather-related loss events globally in each year. b) This figure illustrates the “protection gap”—the proportion of insured losses compared with total economic losses—highlighting the economic loss generated by catastrophes that are not covered by insurance.
Source
Data source: Munich RE, 2020.