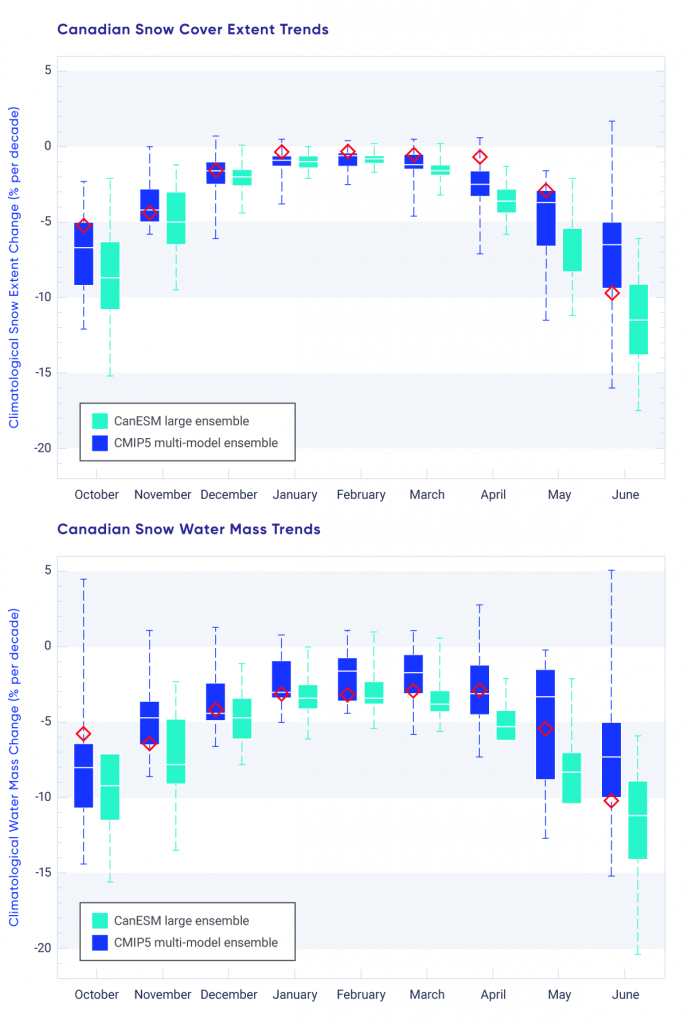
Monthly projected trends in Canadian snow cover extent (top) and snow water mass (bottom) from the Coupled Model Intercomparison Project (CMIP5) multi-model ensemble (blue) and from the Canadian Earth System Model (CanESM) large ensemble (aqua), under a high emission scenario (RCP8.5). Monthly mean observational trends (1981–2015) from the snow dataset used in Section 5.1.1 are shown in red. Boxes show the 25th–75th percentile range, the horizontal line shows the median, and the dashed whiskers illustrate the minimum and maximum.
Source
Mudryk et al. (2018)