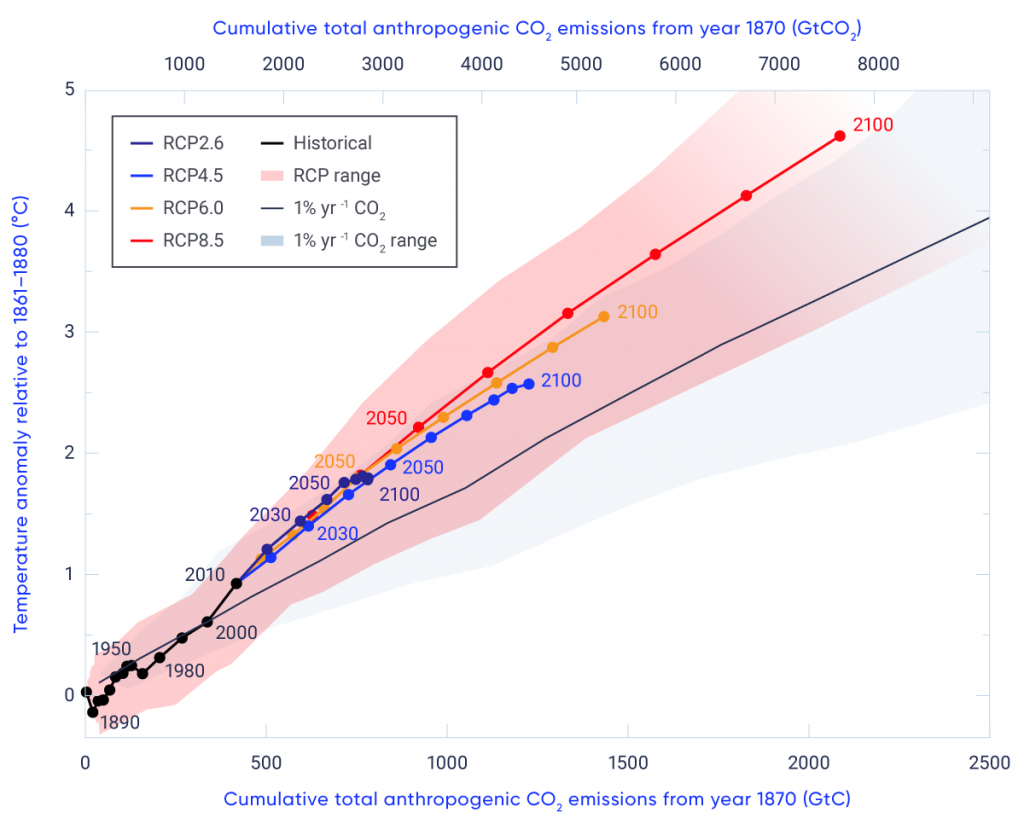
Increases in global mean surface temperature with increasing cumulative carbon dioxide (CO2) emissions (lower axis label refers to emissions in gigatonnes of carbon, upper axis label in gigatonnes of CO2). Coloured lines show multi-model average results from the Climate Model Intercomparison Project (CMIP5) for each Representative Concentration Pathway (RCP) until 2100, and dots show decadal means. Model results over the historical period (1860 to 2010) are indicated in black. The coloured plume illustrates the multi-model spread over the historical and four RCP scenarios. The thin black line and grey area indicate the multi-model mean (line) and range (area) simulated by CMIP5 models resulting from a CO2 increase of 1% per year.
Source
Adapted from IPCC (2013), Figure SPM.10.