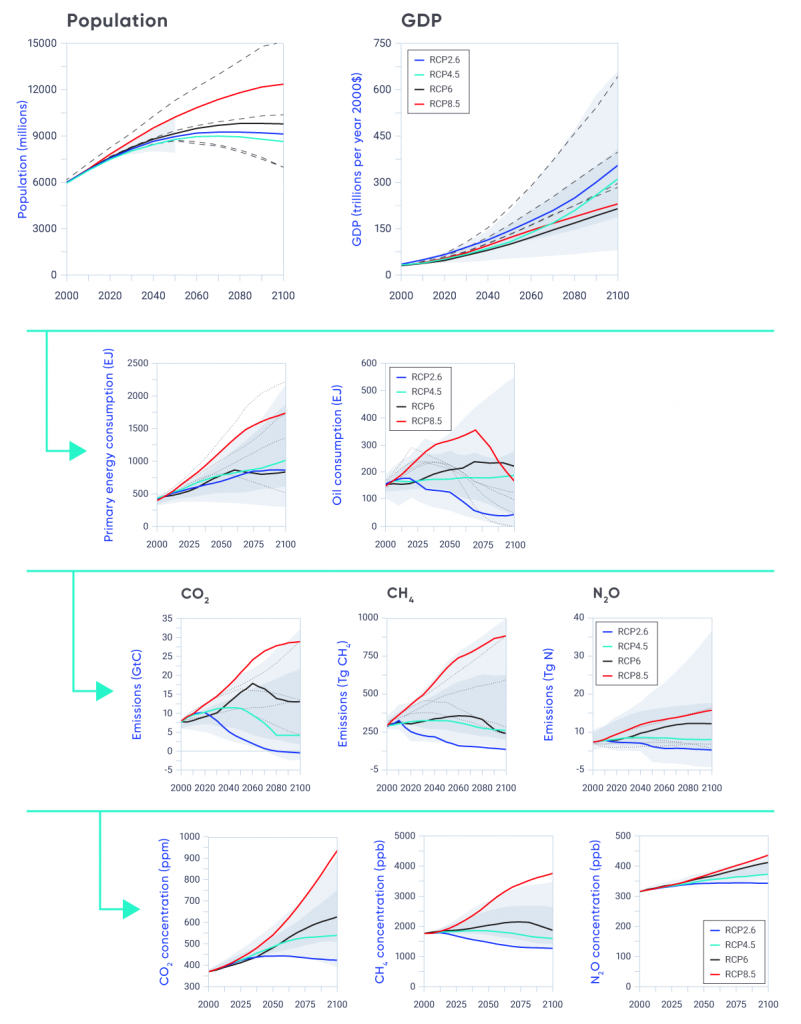
Figure-3.1: Underlying features of the Representative Concentration Pathways


Socioeconomic (top row), energy intensity (second row), greenhouse gas emissions (third row), and ultimately greenhouse gas concentration (bottom row) scenarios underlying the Representative Concentration Pathways (RCPs) used to drive future climate projections. The light grey shading indicates the 98th percentile and the dark grey shading the 90th percentile of the underlying databases.
Reproduced from van Vuuren et al. (2011), where further details are provided.