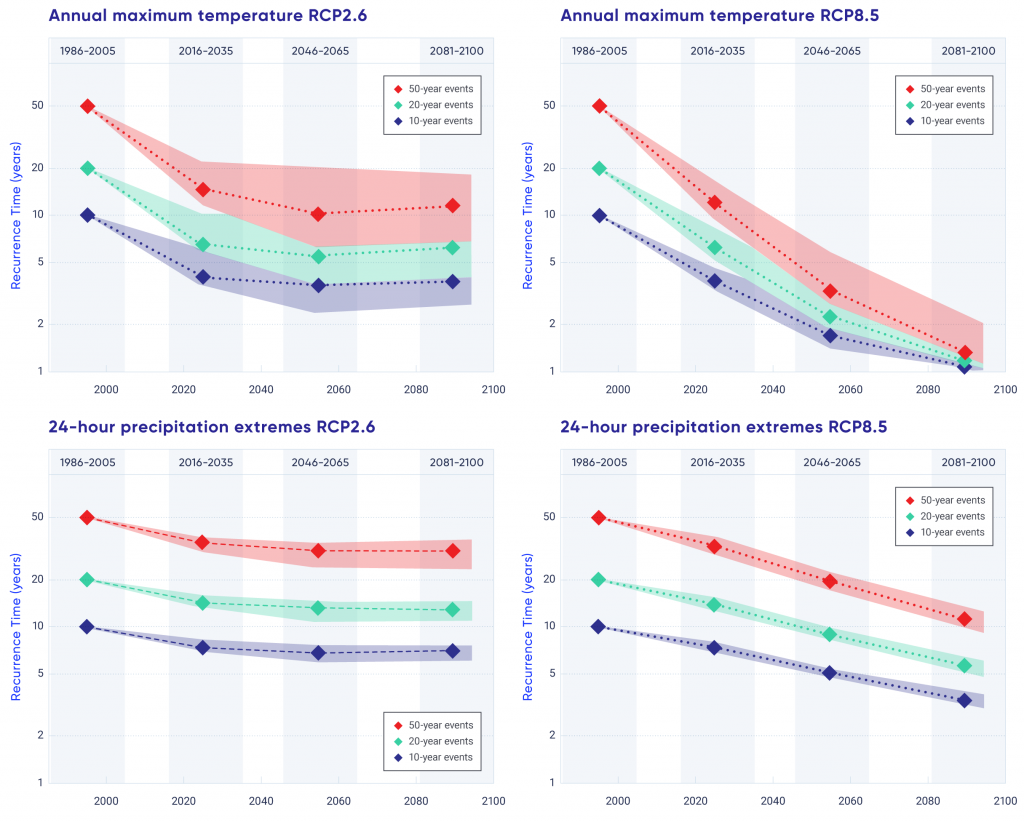
Figure ES5: Top panels: Projected changes in recurrence time (in years) for annual highest temperatures that occurred, on average, once in 10, 20, and 50 years in the late 20th century across Canada, as simulated by the Coupled Model Intercomparison Project (CMIP5) multi-model ensemble under a low emission scenario (RCP2.6) and a high emission scenario (RCP8.5). Lower […]

Top panels: Projected changes in recurrence time (in years) for annual highest temperatures that occurred, on average, once in 10, 20, and 50 years in the late 20th century across Canada, as simulated by the Coupled Model Intercomparison Project (CMIP5) multi-model ensemble under a low emission scenario (RCP2.6) and a high emission scenario (RCP8.5). Lower panels: Projected changes in recurrence time for annual maximum 24-hour precipitation. From Chapter 4 Figures 4.12 and 4.20.